Building My First Pi-hole-Powered Home Network Monitor with Grafana and Prometheus on a Raspberry Pi

Introduction:#
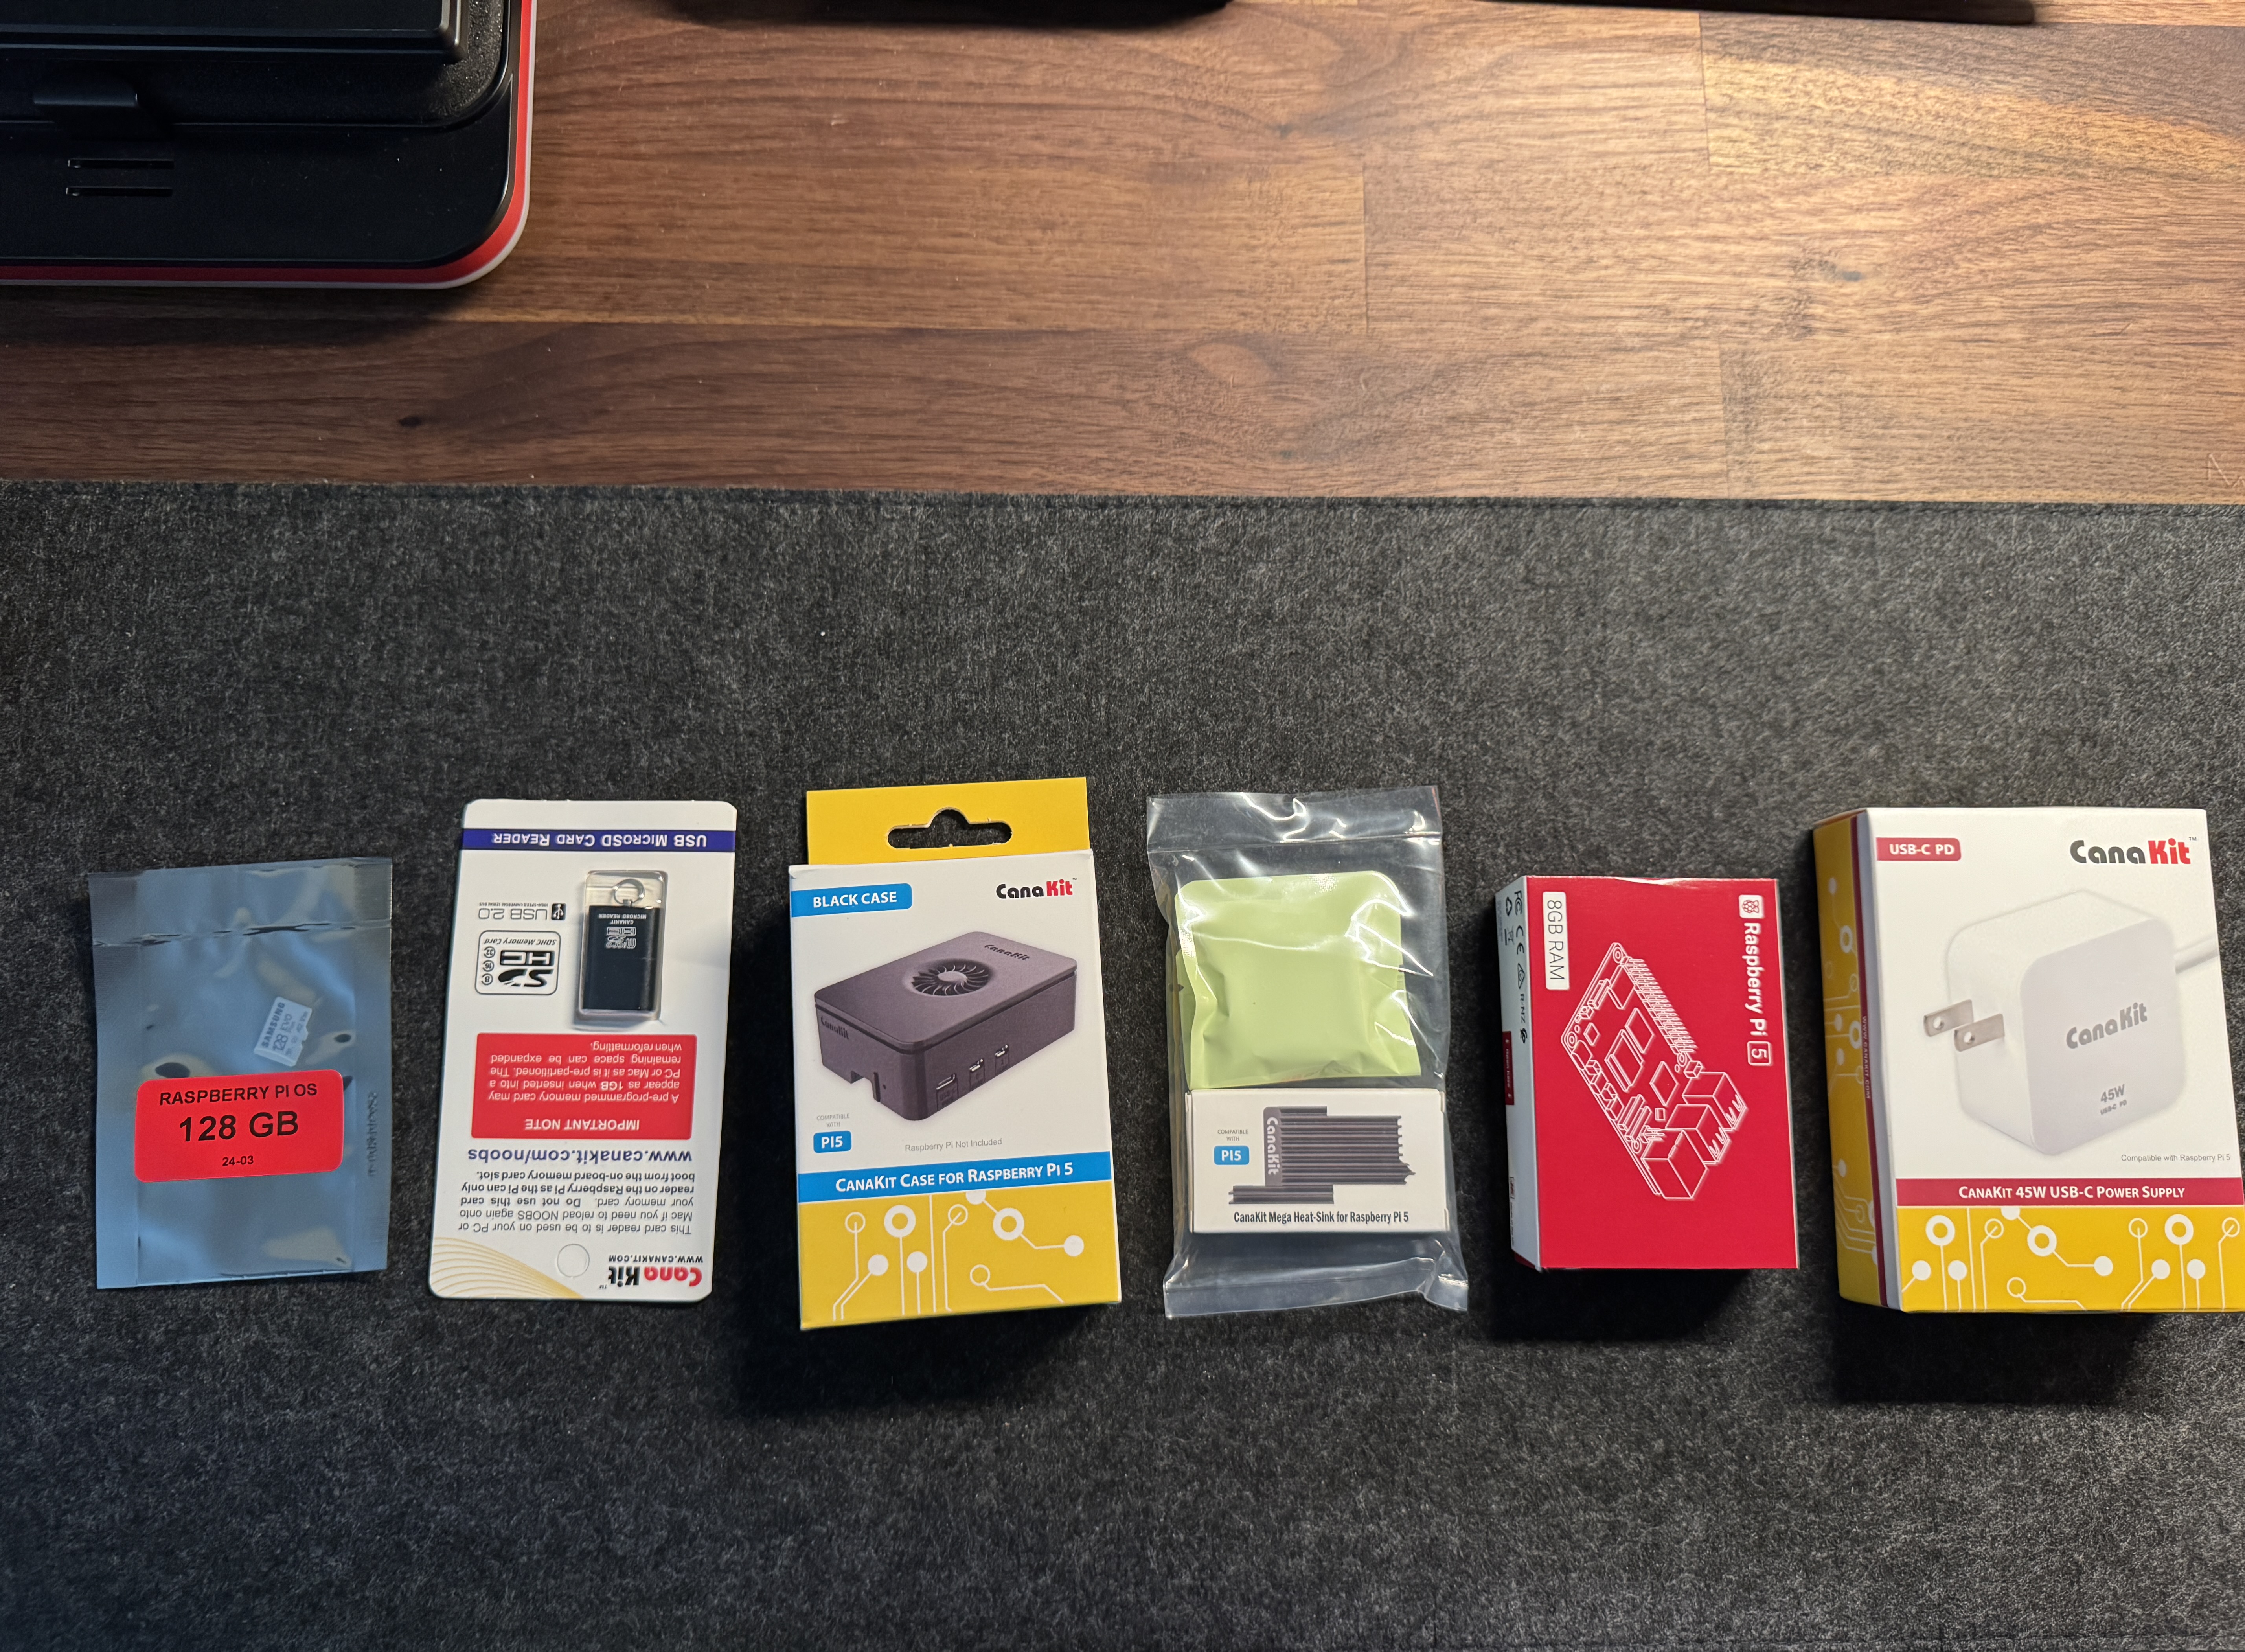
Until now, most of my DevOps journey had been software-driven. Cloud, containers, automation scripts, and lots of terminal work. But this time, I decided to get physical. I ordered my very first Raspberry Pi and spent a Saturday afternoon putting it all together. It was exciting, nerve-racking, and deeply rewarding. I even snapped a few pictures while assembling everything (I’ll include them below for some visual fun).
There’s something special about seeing your hands bring to life a small but mighty computer that will become the centerpiece of your home network’s monitoring and ad-blocking system. This project combined both hardware and software in a way that really deepened my understanding of infrastructure, both physical and logical.
Project Overview: What I Set Out to Build#
I wanted to build a home network monitoring stack using the Raspberry Pi, but not just that, I also wanted to block ads and track DNS traffic across my LAN. The key components of this project were:
Pi-hole for DNS-level ad-blocking and local DNS traffic visibility
Prometheus for scraping metrics
Grafana for visualizing them beautifully
node_exporter to get system-level metrics from the Pi
pihole-exporter to expose Pi-hole metrics in Prometheus-friendly format
My goal wasn’t just to set everything up, I also wanted this stack to run in Docker, make the configuration secure and reusable, and document every step so that others could easily follow along.
Building the Stack: Challenges and Breakthroughs#
Here are a few challenges I encountered and what I learned:
Securing Pi-hole Admin Credentials#
Initially, I had hardcoded the Pi-hole admin credentials directly into the docker-compose.yml. This worked but felt insecure, especially if I planned to push this to GitHub. I solved this by moving sensitive data into a .env file. It was a small change but an important lesson in secure DevOps practices.
DNS Not Forwarding Properly#
I wanted to route all local DNS traffic through Pi-hole to see every device’s DNS queries, but my router didn’t support custom DNS settings or manual DHCP configuration. I tried multiple methods, including modifying each device individually, but ultimately decided to leave it as-is and note the limitation in the README.
Metrics Not Showing Up#
At one point, the Prometheus dashboard wasn’t loading, and after double-checking the configuration, I realized I had a YAML indentation issue (a missing space in targets:). A small mistake, but a perfect reminder of how brittle configuration files can be. Once fixed, the dashboard came back to life.
The Stack in Action: What’s Working#
Once everything was up and running, here’s what I achieved:
Real-time visualization of Pi-hole metrics (like blocked queries, permitted domains, etc.) in Grafana
Full visibility into the Raspberry Pi system metrics: CPU, RAM, disk usage, and more
Fully containerized setup, managed via Docker Compose
Secure, portable, and version-controlled environment that I can replicate anytime
A deeper appreciation for networking at home and how monitoring systems operate at the edge
A Visual Glimpse: Raspberry Pi in the Making#
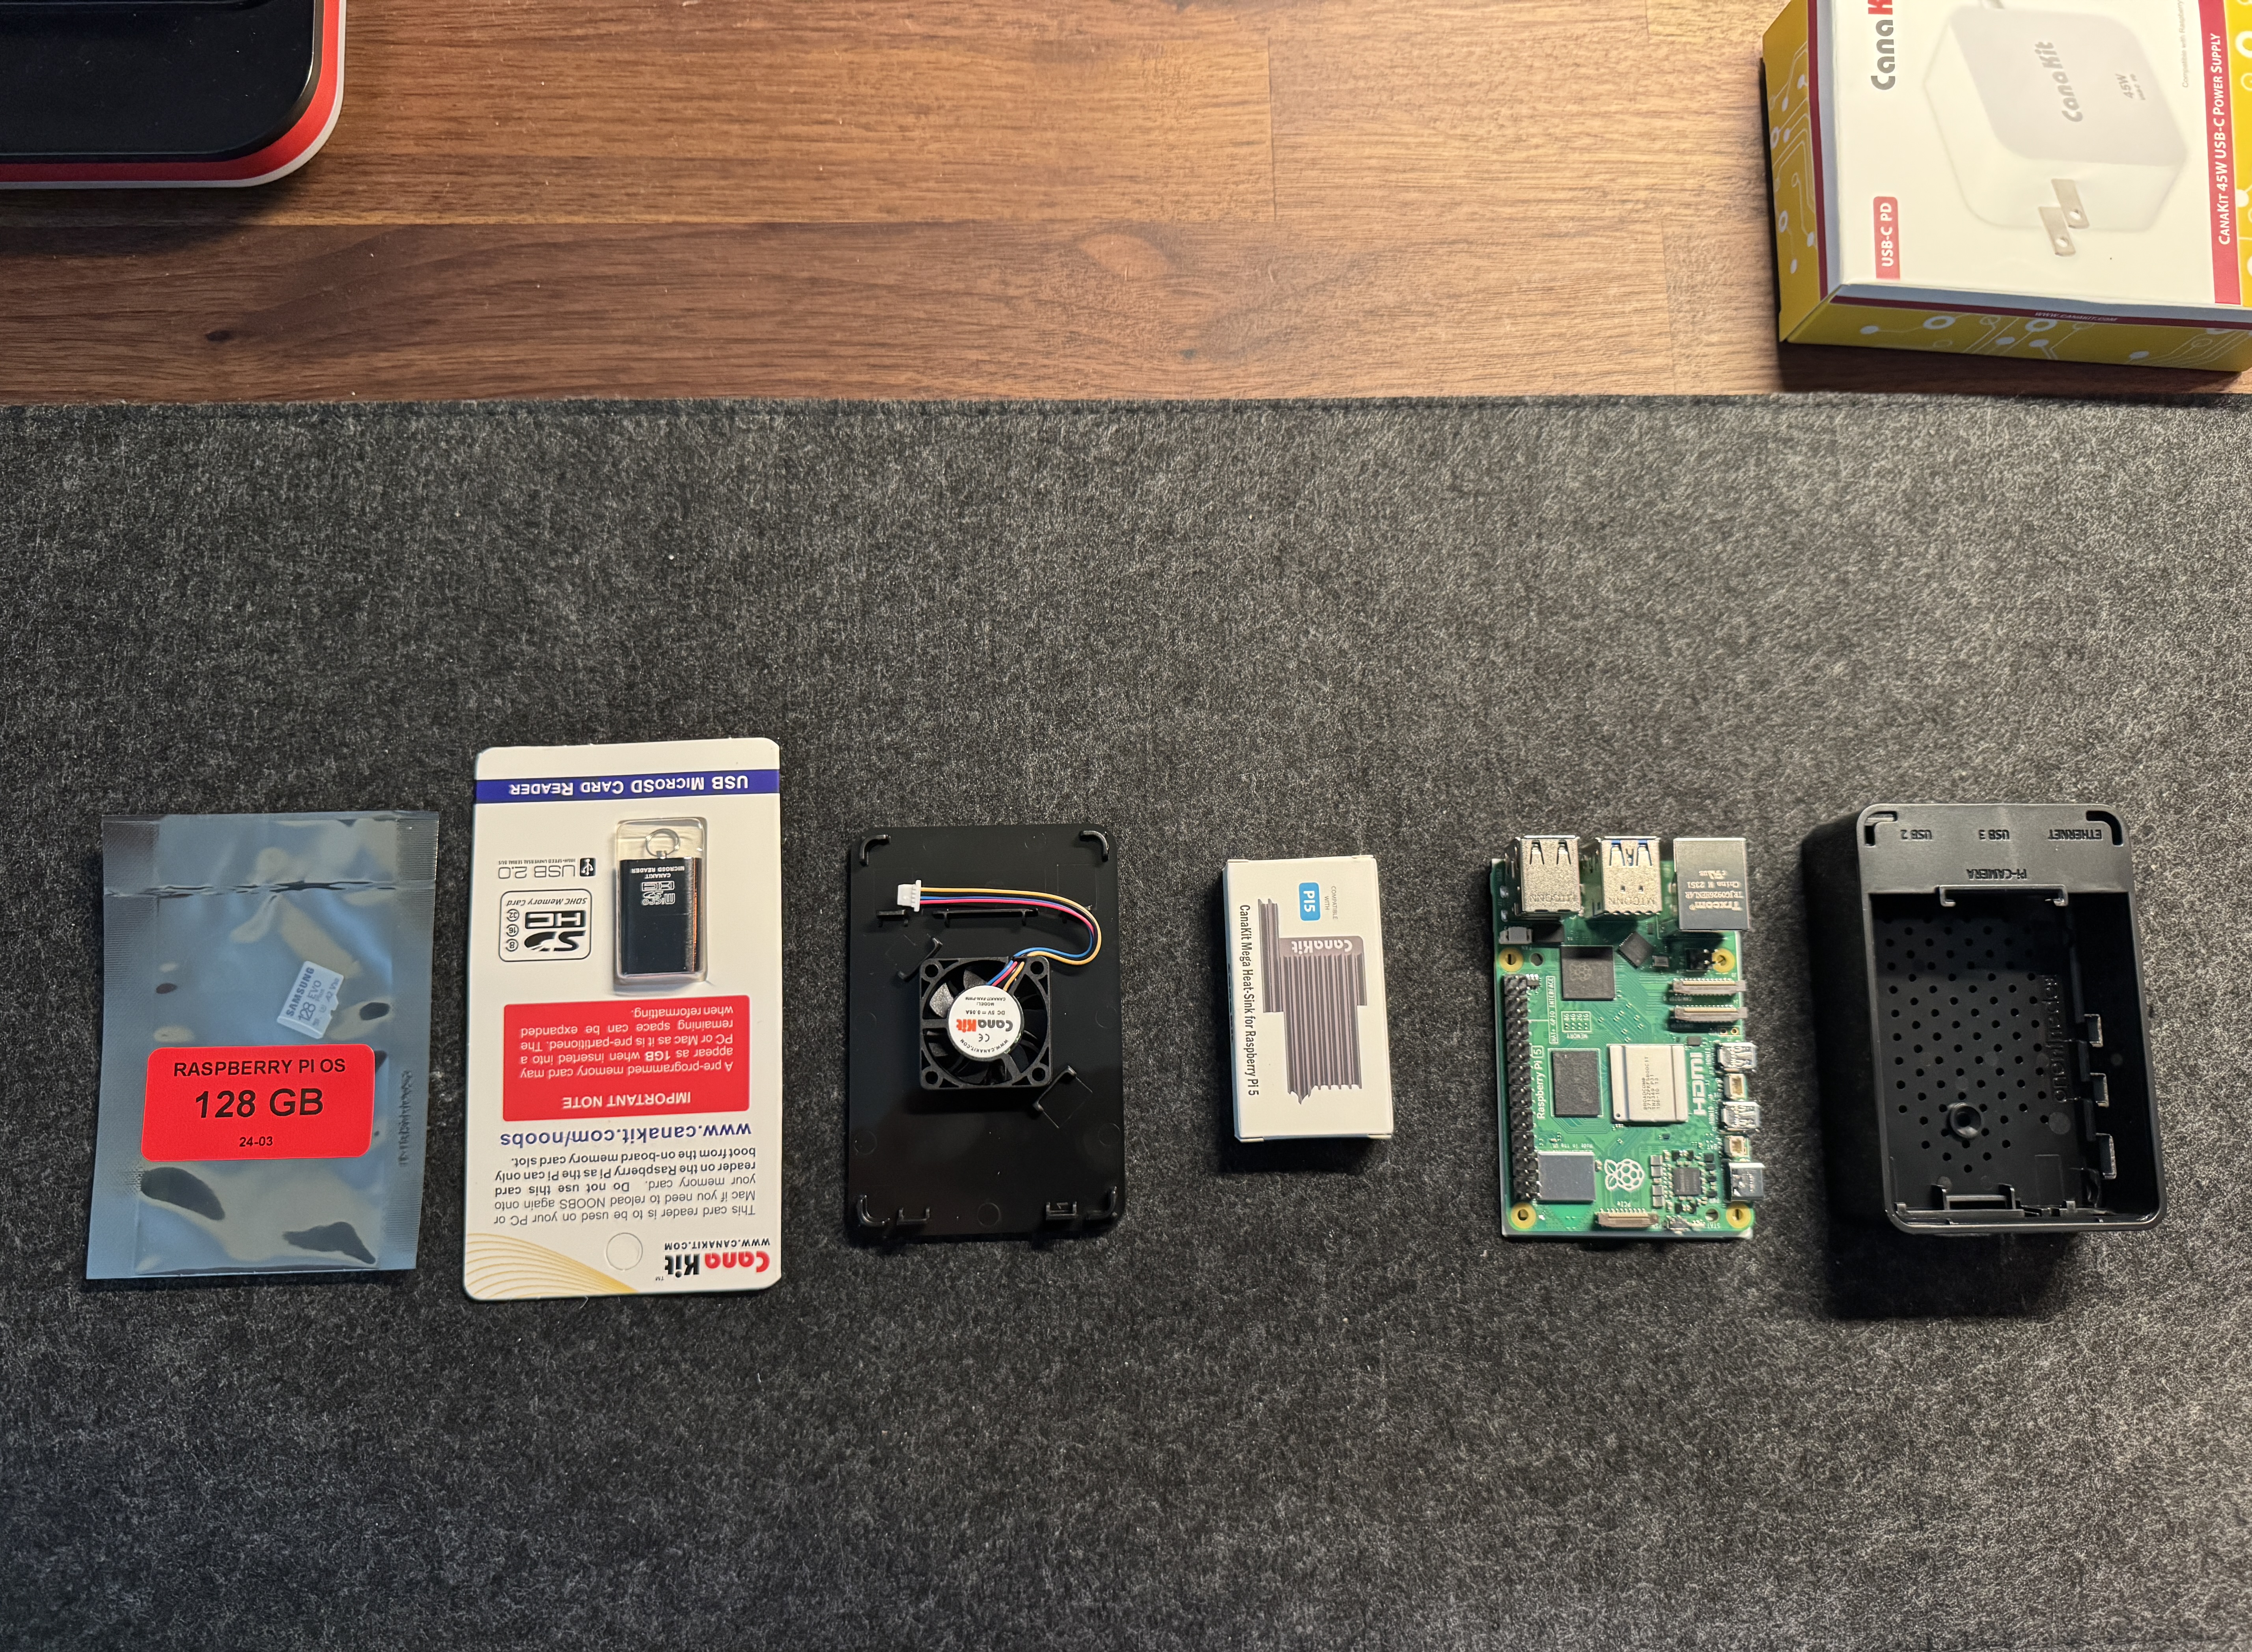
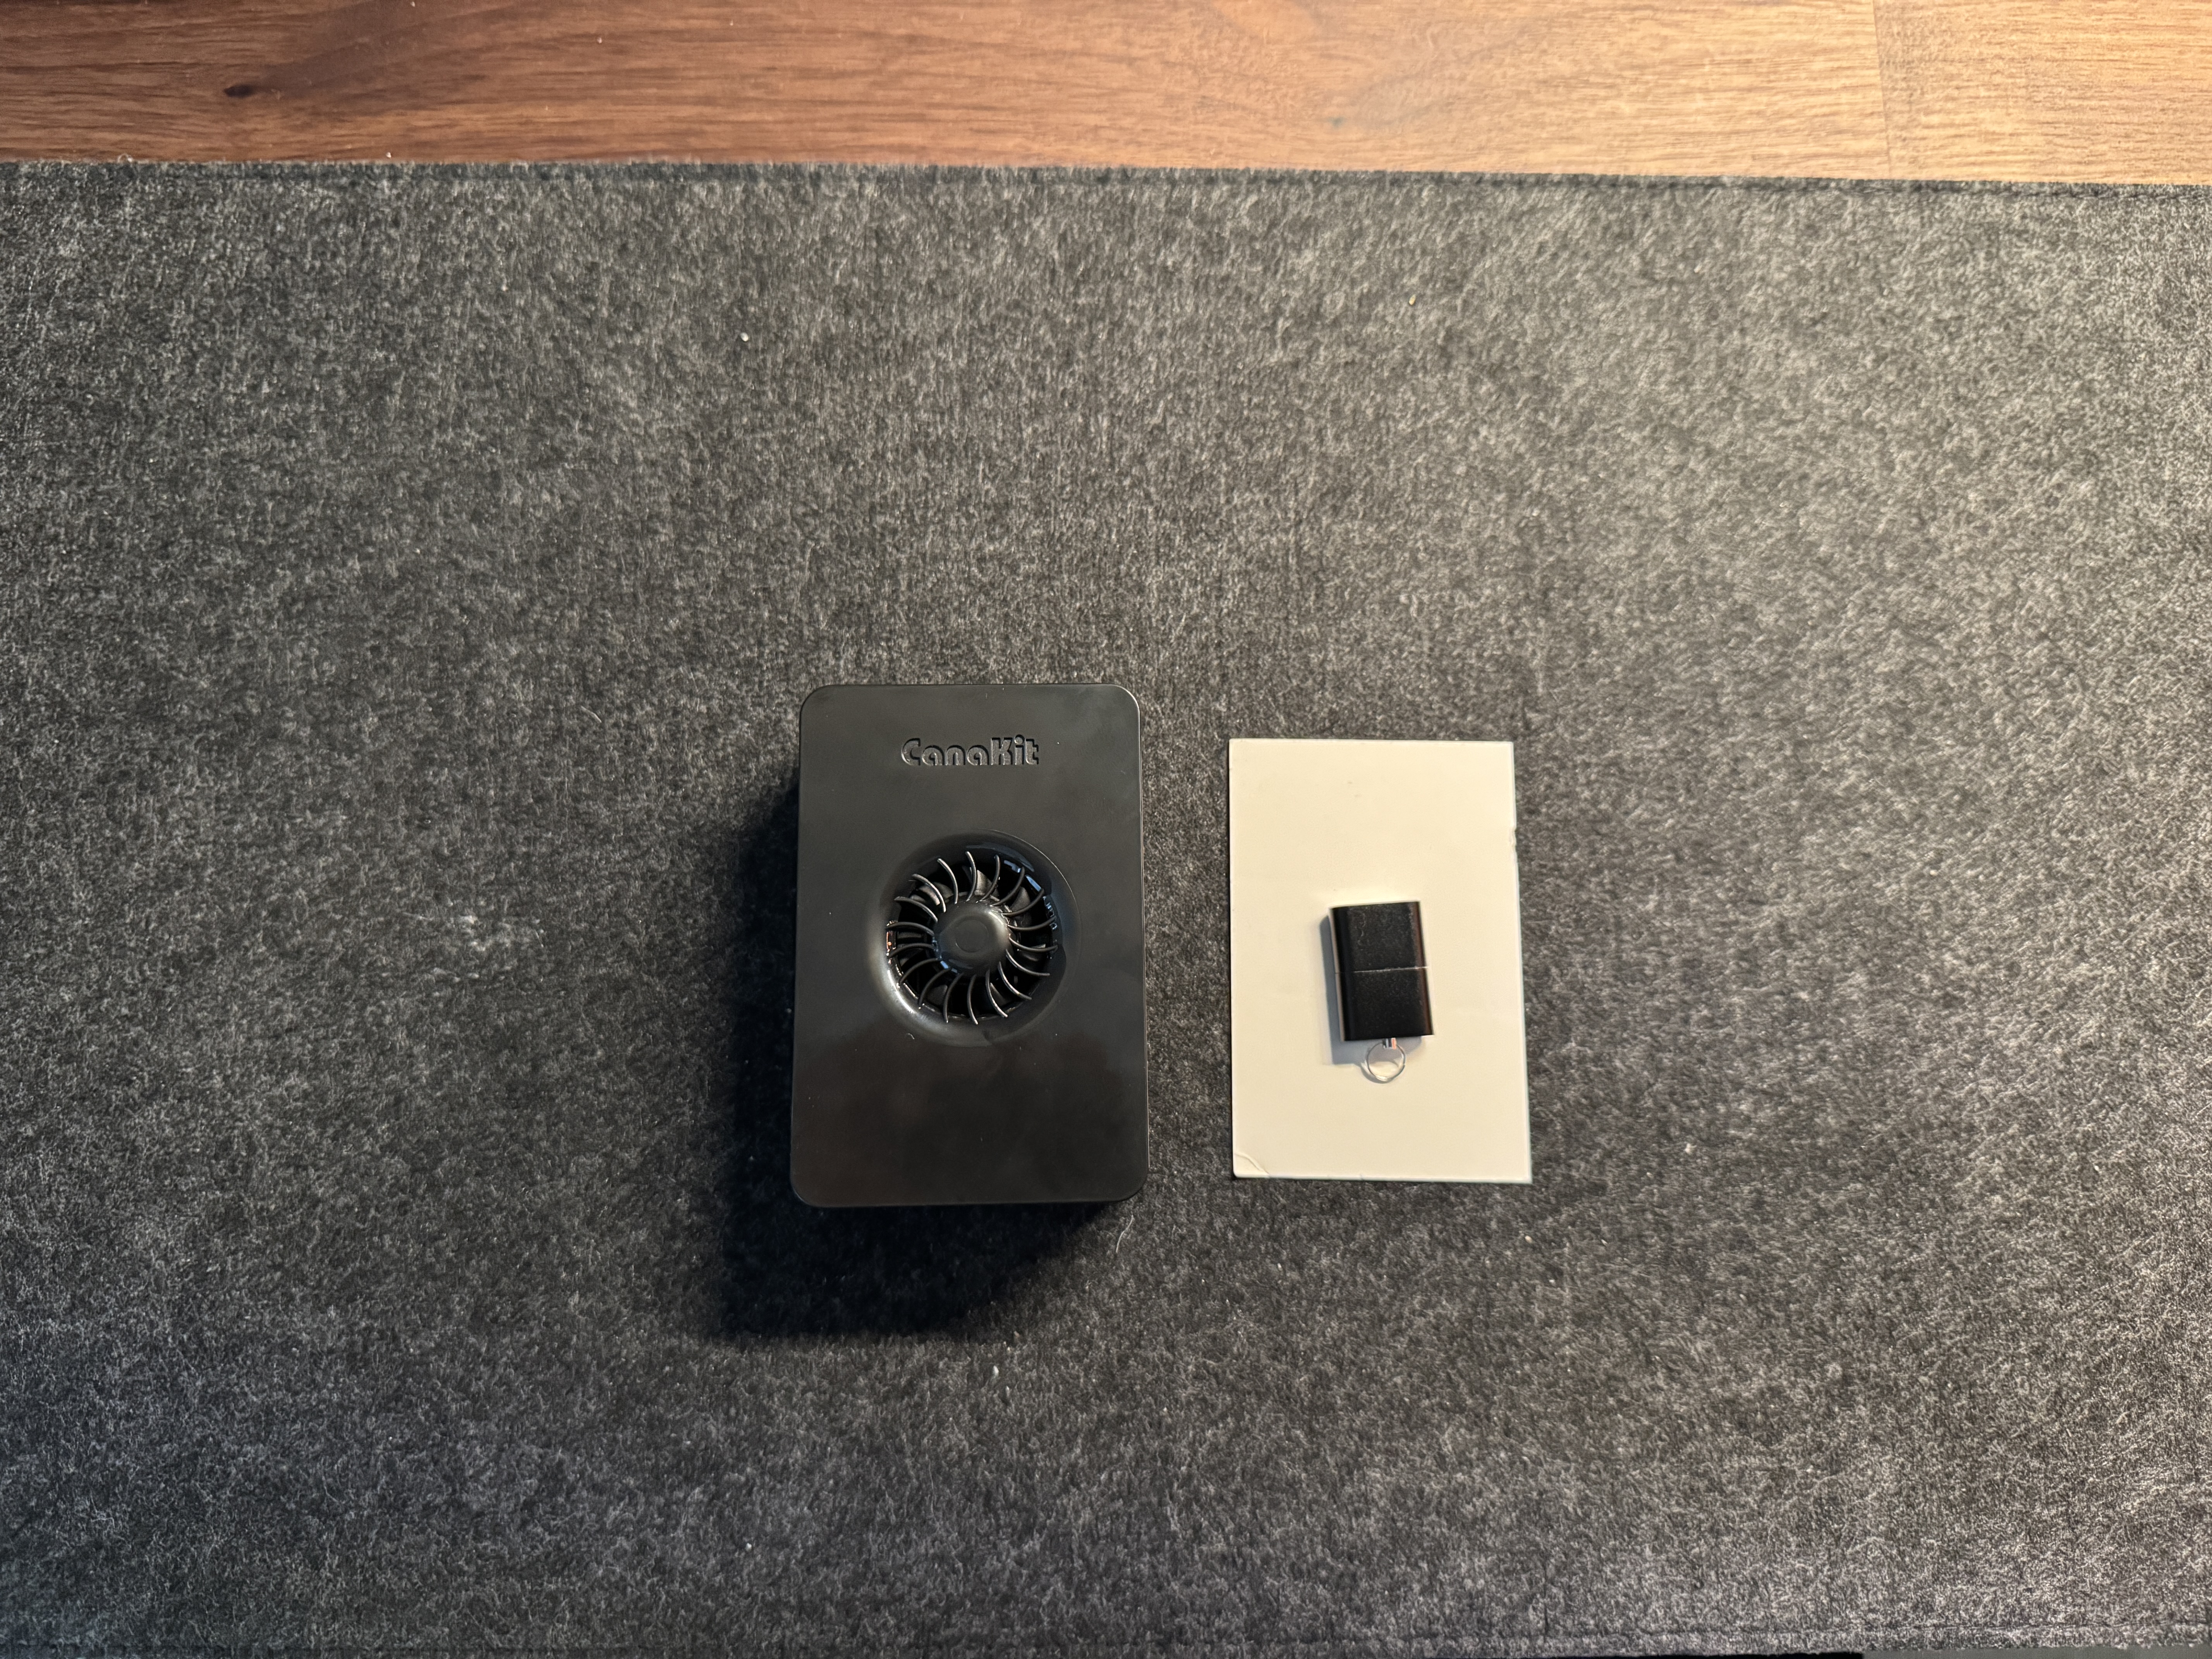
These photos remind me of the joy and satisfaction that came from building something both physical and digital. This is what DevOps is all about: bridging gaps and making things work, end to end.
Want to Recreate This?#
I’ve created a complete GitHub repository with:
Step-by-step setup instructions
Configuration files (including
docker-compose.ymlandprometheus.yml)Security improvements
Troubleshooting tips
Screenshots of the final dashboards
If you’re curious about DevOps, home networking, or want to get started with Raspberry Pi and Docker, feel free to clone the repo and try it for yourself!
What I Learned#
Working with hardware adds a whole new layer of appreciation for infrastructure
Monitoring tools like Prometheus and Grafana can be intimidating at first, but once configured, they’re an incredible source of visibility
Security should never be an afterthought, even for home lab projects
Thanks for reading. More projects coming soon—this was only Project #3 out of 50+ on the roadmap.